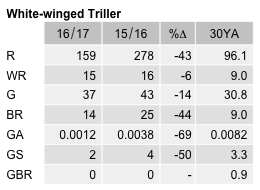
White-winged Triller
Lalage tricolor
ABR description
The following is extracted from the Annual Bird Report for the twelve months to June 2017.
Uncommon, breeding summer migrant
Declared vulnerable in the ACT.
General: Although the number of records annually has increased markedly since the time of the declaration, the reporting rate has fluctuated markedly and is low again this year. 376 birds recorded, far fewer than last year (731), similar to the 10YA (418) and more than the 30YA (202). Recorded in every month from Aug to Feb: first 2/7 Aug Higgins (CnM1) and last 3/19 Feb Callum Brae NR (HeS1). Reporting rate (1.2%) half of last year’s 2.4% and well below the 10YA and the 30YA (both 3.5%). Recorded from 12% of grid cells surveyed (14% last year). Max 11 (18 last year), mean 2.3, median 2. 14 breeding records compared with 25 last year, the same as the 10YA and more than the 30YA (9): from nb/13 Nov Campbell Park GrM13 (COF1) to dy/19 Feb Callum Brae NR GrL15 (HeS1).
GBS: Just 3 records (8 last year), well below the 10YA (14) and the 30YA (12), all of 1 bird, from 1 urban and 1 rural site: 1/4wk Nov Curtin GrK14 (AjR1), 1/2/wk Dec Carwoola GrQ16 (BuM1) and 1/3 wk Dec same site and observer. No breeding records (and none last year).
Abundance
Abundance is the average number of birds of that species per survey. Where the species was observed (presence recorded) but the number of birds seen was not recorded, this is treated as a count of zero.
Abundance by year
This chart shows the abundance of White-winged Triller between 1982 and 2017. 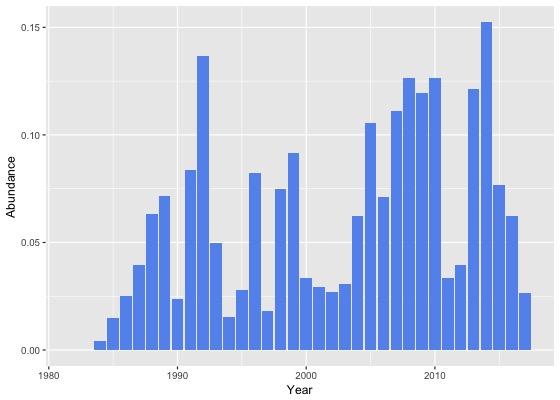
Abundance by month
This chart shows the monthly abundance of White-winged Triller. The blue lines show the abundance for the twelve months to June 2017 and the bars show the average abundance for the period 1982 to 2017. 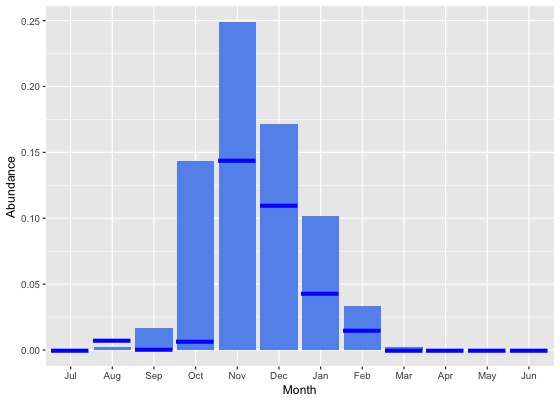
Abundance by season
This chart shows the seasonal abundance of White-winged Triller. The blue lines show the seasonal abundance for the twelve months to June 2017 and the bars show the average seasonal abundance for the period 1982 to 2017. 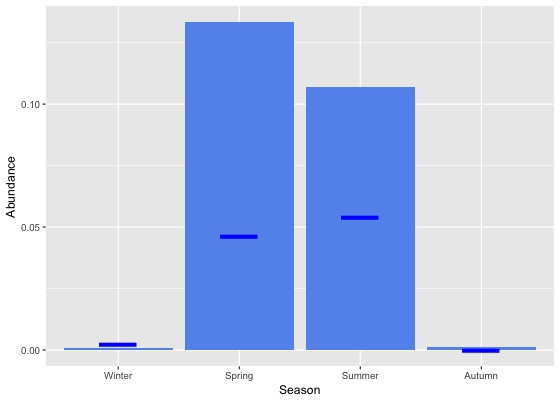
Abundance data
| Month | Season | ||||||||||||||||||
|---|---|---|---|---|---|---|---|---|---|---|---|---|---|---|---|---|---|---|---|
| Period | Jul | Aug | Sep | Oct | Nov | Dec | Jan | Feb | Mar | Apr | May | Jun | Winter | Spring | Summer | Autumn | All | ||
| All years | |||||||||||||||||||
| All | 0.0 | 0.0 | 0.0 | 0.1 | 0.2 | 0.2 | 0.1 | 0.0 | 0.0 | 0.0 | 0.0 | 0.0 | 0.0 | 0.1 | 0.1 | 0.0 | 0.1 | ||
| Previous years | |||||||||||||||||||
| All previous years | 0.0 | 0.0 | 0.0 | 0.2 | 0.3 | 0.2 | 0.1 | 0.0 | 0.0 | 0.0 | 0.0 | 0.0 | 0.0 | 0.1 | 0.1 | 0.0 | 0.1 | ||
| Previous 30 years | 0.0 | 0.0 | 0.0 | 0.2 | 0.3 | 0.2 | 0.1 | 0.0 | 0.0 | 0.0 | 0.0 | 0.0 | 0.0 | 0.1 | 0.1 | 0.0 | 0.1 | ||
| Previous 20 years | 0.0 | 0.0 | 0.0 | 0.2 | 0.3 | 0.2 | 0.1 | 0.0 | 0.0 | 0.0 | 0.0 | 0.0 | 0.0 | 0.2 | 0.1 | 0.0 | 0.1 | ||
| 10 year groups | |||||||||||||||||||
| [2007,2017) | 0.0 | 0.0 | 0.0 | 0.2 | 0.4 | 0.2 | 0.1 | 0.0 | 0.0 | 0.0 | 0.0 | 0.0 | 0.0 | 0.2 | 0.1 | 0.0 | 0.1 | ||
| [1997,2007) | 0.0 | 0.0 | 0.0 | 0.1 | 0.2 | 0.2 | 0.1 | 0.0 | 0.0 | 0.0 | 0.0 | 0.0 | 0.0 | 0.1 | 0.1 | 0.0 | 0.1 | ||
| [1987,1997) | 0.0 | 0.0 | 0.0 | 0.1 | 0.1 | 0.2 | 0.1 | 0.1 | 0.0 | 0.0 | 0.0 | 0.0 | 0.0 | 0.1 | 0.1 | 0.0 | 0.1 | ||
| 5 year groups | |||||||||||||||||||
| [2012,2017) | 0.0 | 0.0 | 0.0 | 0.2 | 0.3 | 0.2 | 0.1 | 0.0 | 0.0 | 0.0 | 0.0 | 0.0 | 0.0 | 0.2 | 0.1 | 0.0 | 0.1 | ||
| [2007,2012) | 0.0 | 0.0 | 0.1 | 0.2 | 0.4 | 0.2 | 0.1 | 0.1 | 0.0 | 0.0 | 0.0 | 0.0 | 0.0 | 0.2 | 0.1 | 0.0 | 0.1 | ||
| [2002,2007) | 0.0 | 0.0 | 0.0 | 0.1 | 0.2 | 0.2 | 0.1 | 0.0 | 0.0 | 0.0 | 0.0 | 0.0 | 0.0 | 0.1 | 0.1 | 0.0 | 0.1 | ||
| [1997,2002) | 0.0 | 0.0 | 0.0 | 0.1 | 0.2 | 0.2 | 0.0 | 0.0 | 0.0 | 0.0 | 0.0 | 0.0 | 0.0 | 0.1 | 0.1 | 0.0 | 0.0 | ||
| [1992,1997) | 0.0 | 0.0 | 0.0 | 0.1 | 0.2 | 0.3 | 0.0 | 0.1 | 0.0 | 0.0 | 0.0 | 0.0 | 0.0 | 0.1 | 0.1 | 0.0 | 0.1 | ||
| [1987,1992) | 0.0 | 0.0 | 0.0 | 0.1 | 0.1 | 0.1 | 0.1 | 0.1 | 0.0 | 0.0 | 0.0 | 0.0 | 0.0 | 0.1 | 0.1 | 0.0 | 0.1 | ||
| Year | |||||||||||||||||||
| 2017 | 0.0 | 0.0 | 0.0 | 0.0 | 0.1 | 0.1 | 0.0 | 0.0 | 0.0 | 0.0 | 0.0 | 0.0 | 0.0 | 0.0 | 0.1 | 0.0 | 0.0 | ||
| 2016 | 0.0 | 0.0 | 0.0 | 0.2 | 0.3 | 0.2 | 0.1 | 0.0 | 0.0 | 0.0 | 0.0 | 0.0 | 0.0 | 0.2 | 0.1 | 0.0 | 0.1 | ||
| 2015 | 0.0 | 0.0 | 0.0 | 0.2 | 0.3 | 0.1 | 0.1 | 0.0 | 0.0 | 0.0 | 0.0 | 0.0 | 0.0 | 0.2 | 0.1 | 0.0 | 0.1 | ||
| 2014 | 0.0 | 0.0 | 0.0 | 0.4 | 0.7 | 0.3 | 0.2 | 0.0 | 0.0 | 0.0 | 0.0 | 0.0 | 0.0 | 0.3 | 0.2 | 0.0 | 0.2 | ||
| 2013 | 0.0 | 0.0 | 0.0 | 0.2 | 0.4 | 0.3 | 0.2 | 0.1 | 0.0 | 0.0 | 0.0 | 0.0 | 0.0 | 0.2 | 0.2 | 0.0 | 0.1 | ||
| 2012 | 0.0 | 0.0 | 0.0 | 0.0 | 0.1 | 0.2 | 0.0 | 0.0 | 0.0 | 0.0 | 0.0 | 0.0 | 0.0 | 0.0 | 0.1 | 0.0 | 0.0 | ||
| 2011 | 0.0 | 0.0 | 0.0 | 0.0 | 0.1 | 0.1 | 0.1 | 0.1 | 0.0 | 0.0 | 0.0 | 0.0 | 0.0 | 0.0 | 0.1 | 0.0 | 0.0 | ||
| 2010 | 0.0 | 0.0 | 0.1 | 0.2 | 0.4 | 0.2 | 0.3 | 0.1 | 0.0 | 0.0 | 0.0 | 0.0 | 0.0 | 0.2 | 0.2 | 0.0 | 0.1 | ||
| 2009 | 0.0 | 0.0 | 0.0 | 0.3 | 0.3 | 0.3 | 0.1 | 0.1 | 0.0 | 0.0 | 0.0 | 0.0 | 0.0 | 0.2 | 0.2 | 0.0 | 0.1 | ||
| 2008 | 0.0 | 0.0 | 0.0 | 0.3 | 0.6 | 0.2 | 0.2 | 0.1 | 0.0 | 0.0 | 0.0 | 0.0 | 0.0 | 0.2 | 0.2 | 0.0 | 0.1 | ||
| 2007 | 0.0 | 0.0 | 0.1 | 0.2 | 0.7 | 0.2 | 0.1 | 0.0 | 0.0 | 0.0 | 0.0 | 0.0 | 0.0 | 0.3 | 0.1 | 0.0 | 0.1 | ||
| 2006 | 0.0 | 0.0 | 0.0 | 0.2 | 0.2 | 0.2 | 0.2 | 0.0 | 0.0 | 0.0 | 0.0 | 0.0 | 0.0 | 0.1 | 0.2 | 0.0 | 0.1 | ||
| 2005 | 0.0 | 0.0 | 0.0 | 0.1 | 0.5 | 0.3 | 0.5 | 0.0 | 0.0 | 0.0 | 0.0 | 0.0 | 0.0 | 0.2 | 0.3 | 0.0 | 0.1 | ||
| 2004 | 0.0 | 0.0 | 0.0 | 0.1 | 0.2 | 0.2 | 0.1 | 0.0 | 0.0 | 0.0 | 0.0 | 0.0 | 0.0 | 0.1 | 0.1 | 0.0 | 0.1 | ||
| 2003 | 0.0 | 0.0 | 0.0 | 0.0 | 0.2 | 0.1 | 0.0 | 0.0 | 0.0 | 0.0 | 0.0 | 0.0 | 0.0 | 0.1 | 0.0 | 0.0 | 0.0 | ||
| 2002 | 0.0 | 0.0 | 0.0 | 0.0 | 0.1 | 0.1 | 0.0 | 0.1 | 0.0 | 0.0 | 0.0 | 0.0 | 0.0 | 0.0 | 0.1 | 0.0 | 0.0 | ||
| 2001 | 0.0 | 0.0 | 0.0 | 0.1 | 0.1 | 0.1 | 0.0 | 0.0 | 0.0 | 0.0 | 0.0 | 0.0 | 0.0 | 0.1 | 0.1 | 0.0 | 0.0 | ||
| 2000 | 0.0 | 0.0 | 0.0 | 0.1 | 0.1 | 0.1 | 0.1 | 0.0 | 0.0 | 0.0 | 0.0 | 0.0 | 0.0 | 0.1 | 0.0 | 0.0 | 0.0 | ||
| 1999 | 0.0 | 0.0 | 0.0 | 0.1 | 0.4 | 0.5 | 0.1 | 0.0 | 0.0 | 0.0 | 0.0 | 0.0 | 0.0 | 0.1 | 0.2 | 0.0 | 0.1 | ||
| 1998 | 0.0 | 0.0 | 0.0 | 0.1 | 0.3 | 0.2 | 0.0 | 0.0 | 0.0 | 0.0 | 0.0 | 0.0 | 0.0 | 0.1 | 0.1 | 0.0 | 0.1 | ||
| 1997 | 0.0 | 0.0 | 0.0 | 0.0 | 0.0 | 0.1 | 0.0 | 0.0 | 0.0 | 0.0 | 0.0 | 0.0 | 0.0 | 0.0 | 0.1 | 0.0 | 0.0 | ||
| 1996 | 0.0 | 0.0 | 0.1 | 0.2 | 0.2 | 0.3 | 0.0 | 0.0 | 0.0 | 0.0 | 0.0 | 0.0 | 0.0 | 0.2 | 0.1 | 0.0 | 0.1 | ||
| 1995 | 0.0 | 0.0 | 0.0 | 0.0 | 0.1 | 0.0 | 0.0 | 0.3 | 0.0 | 0.0 | 0.0 | 0.0 | 0.0 | 0.0 | 0.1 | 0.0 | 0.0 | ||
| 1994 | 0.0 | 0.0 | 0.0 | 0.0 | 0.1 | 0.1 | 0.0 | 0.0 | 0.0 | 0.0 | 0.0 | 0.0 | 0.0 | 0.0 | 0.0 | 0.0 | 0.0 | ||
| 1993 | 0.0 | 0.0 | 0.0 | 0.0 | 0.3 | 0.3 | 0.0 | 0.0 | 0.0 | 0.0 | 0.0 | 0.0 | 0.0 | 0.1 | 0.1 | 0.0 | 0.0 | ||
| 1992 | 0.0 | 0.0 | 0.0 | 0.2 | 0.5 | 0.7 | 0.1 | 0.1 | 0.0 | 0.0 | 0.0 | 0.0 | 0.0 | 0.2 | 0.3 | 0.0 | 0.1 | ||
| 1991 | 0.0 | 0.0 | 0.0 | 0.1 | 0.2 | 0.3 | 0.3 | 0.1 | 0.0 | 0.0 | 0.0 | 0.0 | 0.0 | 0.1 | 0.2 | 0.0 | 0.1 | ||
| 1990 | 0.0 | 0.0 | 0.0 | 0.0 | 0.0 | 0.1 | 0.2 | 0.0 | 0.0 | 0.0 | 0.0 | 0.0 | 0.0 | 0.0 | 0.1 | 0.0 | 0.0 | ||
| 1989 | 0.0 | 0.0 | 0.0 | 0.2 | 0.2 | 0.2 | 0.1 | 0.1 | 0.0 | 0.0 | 0.0 | 0.0 | 0.0 | 0.1 | 0.1 | 0.0 | 0.1 | ||
| 1988 | 0.0 | 0.0 | 0.0 | 0.2 | 0.1 | 0.1 | 0.1 | 0.1 | 0.0 | 0.0 | 0.0 | 0.0 | 0.0 | 0.1 | 0.1 | 0.0 | 0.1 | ||
| 1987 | 0.0 | 0.0 | 0.0 | 0.1 | 0.1 | 0.1 | 0.1 | 0.0 | 0.0 | 0.0 | 0.0 | 0.0 | 0.0 | 0.1 | 0.1 | 0.0 | 0.0 | ||
| 1986 | 0.0 | 0.0 | 0.0 | 0.2 | 0.0 | 0.1 | 0.0 | 0.0 | 0.0 | 0.0 | 0.0 | 0.0 | 0.0 | 0.1 | 0.0 | 0.0 | 0.0 | ||
| 1985 | 0.0 | 0.0 | 0.0 | 0.0 | 0.0 | 0.0 | 0.0 | 0.0 | 0.0 | 0.0 | 0.0 | 0.0 | 0.0 | 0.0 | 0.0 | 0.0 | 0.0 | ||
| 1984 | 0.0 | 0.0 | 0.0 | 0.0 | 0.0 | 0.0 | 0.0 | 0.0 | 0.0 | 0.0 | 0.0 | 0.0 | 0.0 | 0.0 | 0.0 | 0.0 | 0.0 | ||
| 1983 | 0.0 | 0.0 | 0.0 | 0.0 | 0.0 | 0.0 | 0.0 | 0.0 | 0.0 | - | 0.0 | 0.0 | 0.0 | 0.0 | 0.0 | 0.0 | 0.0 | ||
| 1982 | - | 0.0 | - | 0.0 | 0.0 | 0.0 | - | 0.0 | - | 0.0 | - | 0.0 | 0.0 | 0.0 | 0.0 | 0.0 | 0.0 | ||
Reporting rates
Reporting rate is the proportion of all surveys in which the species was present.
Reporting rate by year
This chart shows the reporting rate of White-winged Triller each year between 1982 and 2017. 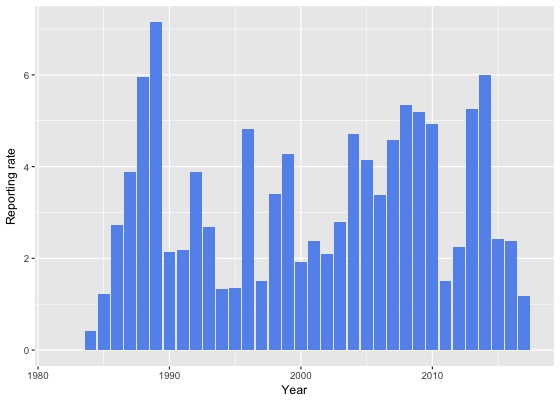
Reporting rate by month
This chart shows the reporting rate by month of White-winged Triller. The blue lines show the reporting rate for the twelve months to June 2017 and the bars show the average reporting rate for the period 1982 to 2017. 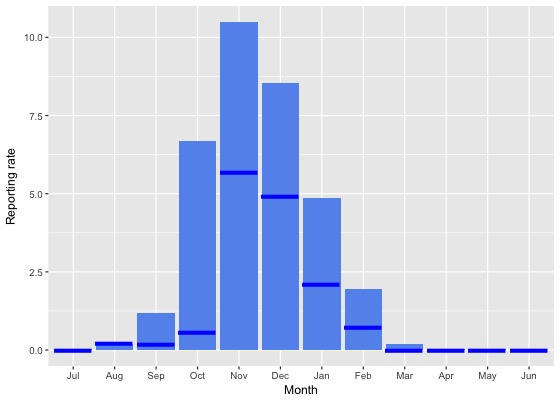
Reporting rate by season
This chart shows the seasonal reporting rate of White-winged Triller. The blue lines show the seasonal reporting rate for the twelve months to June 2017 and the bars show the average seasonal reporting rate for the period 1982 to 2017. 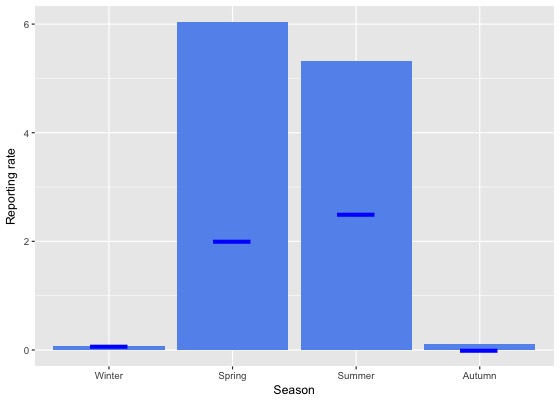
Reporting rate data
| Month | Season | ||||||||||||||||||
|---|---|---|---|---|---|---|---|---|---|---|---|---|---|---|---|---|---|---|---|
| Period | Jul | Aug | Sep | Oct | Nov | Dec | Jan | Feb | Mar | Apr | May | Jun | Winter | Spring | Summer | Autumn | All | ||
| All years | |||||||||||||||||||
| All | 0.0 | 0.2 | 1.2 | 6.7 | 10.5 | 8.5 | 4.9 | 2.0 | 0.2 | 0.0 | 0.0 | 0.0 | 0.1 | 6.0 | 5.3 | 0.1 | 3.2 | ||
| Previous years | |||||||||||||||||||
| All previous years | 0.0 | 0.2 | 1.3 | 7.5 | 11.2 | 9.1 | 5.4 | 2.2 | 0.2 | 0.1 | 0.1 | 0.0 | 0.1 | 6.6 | 5.8 | 0.1 | 3.5 | ||
| Previous 30 years | 0.0 | 0.2 | 1.3 | 7.6 | 11.4 | 9.2 | 5.4 | 2.2 | 0.2 | 0.1 | 0.1 | 0.0 | 0.1 | 6.7 | 5.9 | 0.1 | 3.5 | ||
| Previous 20 years | 0.0 | 0.1 | 1.3 | 7.3 | 11.5 | 8.8 | 5.1 | 1.7 | 0.2 | 0.0 | 0.0 | 0.0 | 0.0 | 6.4 | 5.5 | 0.1 | 3.4 | ||
| 10 year groups | |||||||||||||||||||
| [2007,2017) | 0.0 | 0.1 | 1.3 | 7.5 | 11.9 | 8.5 | 5.4 | 1.9 | 0.2 | 0.0 | 0.1 | 0.0 | 0.0 | 6.7 | 5.5 | 0.1 | 3.5 | ||
| [1997,2007) | 0.0 | 0.0 | 1.1 | 6.4 | 10.7 | 9.5 | 4.1 | 1.1 | 0.2 | 0.1 | 0.0 | 0.0 | 0.0 | 5.7 | 5.6 | 0.1 | 3.1 | ||
| [1987,1997) | 0.0 | 0.6 | 1.7 | 9.3 | 10.9 | 11.3 | 7.3 | 4.8 | 0.5 | 0.1 | 0.1 | 0.1 | 0.2 | 7.7 | 7.9 | 0.2 | 4.2 | ||
| 5 year groups | |||||||||||||||||||
| [2012,2017) | 0.0 | 0.0 | 0.8 | 7.5 | 10.4 | 8.6 | 5.4 | 1.7 | 0.2 | 0.0 | 0.0 | 0.0 | 0.0 | 6.2 | 5.3 | 0.1 | 3.3 | ||
| [2007,2012) | 0.2 | 0.4 | 2.7 | 7.4 | 16.3 | 8.2 | 5.5 | 3.1 | 0.2 | 0.1 | 0.1 | 0.0 | 0.1 | 7.8 | 6.1 | 0.1 | 4.2 | ||
| [2002,2007) | 0.0 | 0.0 | 1.4 | 7.4 | 11.3 | 9.6 | 5.5 | 2.0 | 0.2 | 0.1 | 0.0 | 0.0 | 0.0 | 6.3 | 6.5 | 0.1 | 3.4 | ||
| [1997,2002) | 0.0 | 0.0 | 0.7 | 5.1 | 9.9 | 9.3 | 2.4 | 0.3 | 0.3 | 0.0 | 0.0 | 0.0 | 0.0 | 4.9 | 4.7 | 0.1 | 2.7 | ||
| [1992,1997) | 0.0 | 0.2 | 1.3 | 4.9 | 8.7 | 9.7 | 2.3 | 4.3 | 0.2 | 0.2 | 0.0 | 0.3 | 0.2 | 5.2 | 5.3 | 0.2 | 2.7 | ||
| [1987,1992) | 0.0 | 0.8 | 1.9 | 11.7 | 11.9 | 12.0 | 10.0 | 4.9 | 0.7 | 0.0 | 0.1 | 0.0 | 0.3 | 8.9 | 9.0 | 0.3 | 4.9 | ||
| Year | |||||||||||||||||||
| 2017 | 0.0 | 0.2 | 0.2 | 0.6 | 5.7 | 4.9 | 2.1 | 0.7 | 0.0 | 0.0 | 0.0 | 0.0 | 0.1 | 2.0 | 2.5 | 0.0 | 1.2 | ||
| 2016 | 0.0 | 0.0 | 0.3 | 7.3 | 7.7 | 6.8 | 3.7 | 1.4 | 0.0 | 0.0 | 0.0 | 0.0 | 0.0 | 5.2 | 3.7 | 0.0 | 2.4 | ||
| 2015 | 0.0 | 0.0 | 1.2 | 6.8 | 8.1 | 4.6 | 3.7 | 1.0 | 0.0 | 0.0 | 0.0 | 0.0 | 0.0 | 5.5 | 3.2 | 0.0 | 2.4 | ||
| 2014 | 0.0 | 0.0 | 1.3 | 14.3 | 24.8 | 11.7 | 10.3 | 2.4 | 0.0 | 0.0 | 0.0 | 0.0 | 0.0 | 12.6 | 8.2 | 0.0 | 6.0 | ||
| 2013 | 0.0 | 0.0 | 0.5 | 8.1 | 13.8 | 14.4 | 8.9 | 2.6 | 0.4 | 0.2 | 0.4 | 0.0 | 0.0 | 7.5 | 9.7 | 0.3 | 5.3 | ||
| 2012 | 0.0 | 0.0 | 0.7 | 2.6 | 5.7 | 9.2 | 2.2 | 2.0 | 1.2 | 0.0 | 0.0 | 0.0 | 0.0 | 2.9 | 4.5 | 0.5 | 2.2 | ||
| 2011 | 0.8 | 0.0 | 0.0 | 1.0 | 6.7 | 3.3 | 5.3 | 1.4 | 0.0 | 0.3 | 0.0 | 0.0 | 0.2 | 1.7 | 3.6 | 0.1 | 1.5 | ||
| 2010 | 0.0 | 0.0 | 4.9 | 6.1 | 15.3 | 10.2 | 9.7 | 4.7 | 0.4 | 0.0 | 0.0 | 0.0 | 0.0 | 7.8 | 9.2 | 0.2 | 4.9 | ||
| 2009 | 0.0 | 0.0 | 1.9 | 9.6 | 17.4 | 12.2 | 4.7 | 5.0 | 0.0 | 0.0 | 0.0 | 0.0 | 0.0 | 9.3 | 7.8 | 0.0 | 5.2 | ||
| 2008 | 0.0 | 0.0 | 3.0 | 11.0 | 20.8 | 10.4 | 5.6 | 2.8 | 0.0 | 0.0 | 0.0 | 0.0 | 0.0 | 10.3 | 7.2 | 0.0 | 5.3 | ||
| 2007 | 0.0 | 1.9 | 3.7 | 8.8 | 22.3 | 7.7 | 2.8 | 3.5 | 0.4 | 0.0 | 0.8 | 0.0 | 0.4 | 9.7 | 5.1 | 0.3 | 4.6 | ||
| 2006 | 0.0 | 0.0 | 0.4 | 7.4 | 9.5 | 11.7 | 6.2 | 3.0 | 0.3 | 0.0 | 0.0 | 0.0 | 0.0 | 5.9 | 7.3 | 0.2 | 3.4 | ||
| 2005 | 0.0 | 0.0 | 0.4 | 11.6 | 15.9 | 12.4 | 10.6 | 0.0 | 0.0 | 0.0 | 0.0 | 0.0 | 0.0 | 7.6 | 9.5 | 0.0 | 4.1 | ||
| 2004 | 0.0 | 0.0 | 5.3 | 9.3 | 15.1 | 13.4 | 7.9 | 3.0 | 0.0 | 0.0 | 0.0 | 0.0 | 0.0 | 9.6 | 9.4 | 0.0 | 4.7 | ||
| 2003 | 0.0 | 0.0 | 0.8 | 6.2 | 11.9 | 7.2 | 2.2 | 0.5 | 0.0 | 0.0 | 0.0 | 0.0 | 0.0 | 6.2 | 3.8 | 0.0 | 2.8 | ||
| 2002 | 0.0 | 0.0 | 0.5 | 3.4 | 5.5 | 5.6 | 0.6 | 3.3 | 0.5 | 0.6 | 0.0 | 0.0 | 0.0 | 3.2 | 3.8 | 0.4 | 2.1 | ||
| 2001 | 0.0 | 0.0 | 0.9 | 5.9 | 11.4 | 8.3 | 1.5 | 0.5 | 0.3 | 0.0 | 0.0 | 0.0 | 0.0 | 4.9 | 4.0 | 0.1 | 2.4 | ||
| 2000 | 0.0 | 0.0 | 0.5 | 6.6 | 5.1 | 5.0 | 2.1 | 0.0 | 0.0 | 0.0 | 0.0 | 0.0 | 0.0 | 4.1 | 2.7 | 0.0 | 1.9 | ||
| 1999 | 0.0 | 0.0 | 1.1 | 4.4 | 18.8 | 20.0 | 4.4 | 0.0 | 1.1 | 0.0 | 0.0 | 0.0 | 0.0 | 7.8 | 8.7 | 0.4 | 4.3 | ||
| 1998 | 0.0 | 0.0 | 0.8 | 3.3 | 11.5 | 9.4 | 2.9 | 1.9 | 0.0 | 0.0 | 0.0 | 0.0 | 0.0 | 5.2 | 5.7 | 0.0 | 3.4 | ||
| 1997 | 0.0 | 0.0 | 0.0 | 1.3 | 3.4 | 7.7 | 2.0 | 0.0 | 0.0 | 0.0 | 0.0 | 0.0 | 0.0 | 1.7 | 4.2 | 0.0 | 1.5 | ||
| 1996 | 0.0 | 0.0 | 6.7 | 12.3 | 10.2 | 15.2 | 2.9 | 2.4 | 1.0 | 0.0 | 0.0 | 0.0 | 0.0 | 10.1 | 7.0 | 0.4 | 4.8 | ||
| 1995 | 0.0 | 0.0 | 0.0 | 1.2 | 4.5 | 2.3 | 0.9 | 9.5 | 0.0 | 0.0 | 0.0 | 1.1 | 0.3 | 1.9 | 3.4 | 0.0 | 1.4 | ||
| 1994 | 0.0 | 0.0 | 0.0 | 1.2 | 5.1 | 6.5 | 1.5 | 0.0 | 0.0 | 0.8 | 0.0 | 0.0 | 0.0 | 2.8 | 2.3 | 0.3 | 1.3 | ||
| 1993 | 0.0 | 1.3 | 0.0 | 2.7 | 15.2 | 13.0 | 2.0 | 0.0 | 0.0 | 0.0 | 0.0 | 0.0 | 0.5 | 5.9 | 5.5 | 0.0 | 2.7 | ||
| 1992 | 0.0 | 0.0 | 0.0 | 7.4 | 13.9 | 11.1 | 5.2 | 9.8 | 0.0 | 0.0 | 0.0 | 0.0 | 0.0 | 6.8 | 8.6 | 0.0 | 3.9 | ||
| 1991 | 0.0 | 0.0 | 0.0 | 3.9 | 7.2 | 5.4 | 7.1 | 2.0 | 0.0 | 0.0 | 0.0 | 0.0 | 0.0 | 3.8 | 5.0 | 0.0 | 2.2 | ||
| 1990 | 0.0 | 0.5 | 0.0 | 3.1 | 4.7 | 6.9 | 12.5 | 1.4 | 1.1 | 0.0 | 0.0 | 0.0 | 0.2 | 2.7 | 7.0 | 0.4 | 2.1 | ||
| 1989 | 0.0 | 1.7 | 3.1 | 18.1 | 19.2 | 18.7 | 10.6 | 5.7 | 1.1 | 0.0 | 0.7 | 0.0 | 0.7 | 13.4 | 12.1 | 0.6 | 7.1 | ||
| 1988 | 0.0 | 0.4 | 4.5 | 17.2 | 14.5 | 14.4 | 8.0 | 7.4 | 1.0 | 0.0 | 0.0 | 0.0 | 0.1 | 13.0 | 10.0 | 0.3 | 6.0 | ||
| 1987 | 0.0 | 0.0 | 0.4 | 6.2 | 9.0 | 6.6 | 11.3 | 4.2 | 0.0 | 0.0 | 0.0 | 0.0 | 0.0 | 5.6 | 7.1 | 0.0 | 3.9 | ||
| 1986 | 0.0 | 0.0 | 0.0 | 16.7 | 8.5 | 5.9 | 0.0 | 0.0 | 0.0 | 0.0 | 0.0 | 0.0 | 0.0 | 7.4 | 2.2 | 0.0 | 2.7 | ||
| 1985 | 0.0 | 0.0 | 0.0 | 2.3 | 3.5 | 1.7 | 0.0 | 0.0 | 0.0 | 0.0 | 0.0 | 0.0 | 0.0 | 2.1 | 1.2 | 0.0 | 1.2 | ||
| 1984 | 0.0 | 0.0 | 0.0 | 0.0 | 0.0 | 0.0 | 0.0 | 3.0 | 0.0 | 0.0 | 0.0 | 0.0 | 0.0 | 0.0 | 1.4 | 0.0 | 0.4 | ||
| 1983 | 0.0 | 0.0 | 0.0 | 0.0 | 0.0 | 0.0 | 0.0 | 0.0 | 0.0 | - | 0.0 | 0.0 | 0.0 | 0.0 | 0.0 | 0.0 | 0.0 | ||
| 1982 | - | 0.0 | - | 0.0 | 0.0 | 0.0 | - | 0.0 | - | 0.0 | - | 0.0 | 0.0 | 0.0 | 0.0 | 0.0 | 0.0 | ||
Breeding data
Breeding records by month
Number of breeding records by breeding code and month, 2017 and all years| Breeding code | Jul | Aug | Sep | Oct | Nov | Dec | Jan | Feb | Mar | Apr | May | Jun |
|---|---|---|---|---|---|---|---|---|---|---|---|---|
| 2017 | ||||||||||||
| Breeding (BLA code) | 0 | 0 | 0 | 0 | 0 | 0 | 0 | 0 | 0 | 0 | 0 | 0 |
| Carrying Food | 0 | 0 | 0 | 0 | 0 | 0 | 0 | 0 | 0 | 0 | 0 | 0 |
| Copulating | 0 | 0 | 0 | 0 | 0 | 0 | 0 | 0 | 0 | 0 | 0 | 0 |
| Display | 0 | 0 | 0 | 0 | 0 | 0 | 0 | 0 | 0 | 0 | 0 | 0 |
| Dependent young | 0 | 0 | 0 | 0 | 0 | 0 | 4 | 4 | 0 | 0 | 0 | 0 |
| Faecal sac | 0 | 0 | 0 | 0 | 0 | 0 | 0 | 0 | 0 | 0 | 0 | 0 |
| Inspecting hollow | 0 | 0 | 0 | 0 | 0 | 0 | 0 | 0 | 0 | 0 | 0 | 0 |
| Nest building | 0 | 0 | 0 | 0 | 1 | 0 | 0 | 0 | 0 | 0 | 0 | 0 |
| Nest with eggs | 0 | 0 | 0 | 0 | 0 | 0 | 0 | 0 | 0 | 0 | 0 | 0 |
| Nest with young | 0 | 0 | 0 | 0 | 0 | 1 | 0 | 0 | 0 | 0 | 0 | 0 |
| On/leaving nest | 0 | 0 | 0 | 0 | 0 | 4 | 0 | 0 | 0 | 0 | 0 | 0 |
| All years | ||||||||||||
| Breeding (BLA code) | 0 | 0 | 0 | 1 | 1 | 4 | 6 | 0 | 0 | 0 | 0 | 0 |
| Carrying Food | 0 | 0 | 0 | 0 | 4 | 9 | 5 | 0 | 0 | 0 | 0 | 0 |
| Copulating | 0 | 0 | 0 | 2 | 0 | 0 | 0 | 0 | 0 | 0 | 0 | 0 |
| Display | 0 | 0 | 0 | 9 | 5 | 0 | 0 | 0 | 0 | 0 | 0 | 0 |
| Dependent young | 0 | 0 | 0 | 0 | 4 | 18 | 48 | 20 | 0 | 0 | 0 | 0 |
| Faecal sac | 0 | 0 | 0 | 0 | 0 | 0 | 0 | 0 | 0 | 0 | 0 | 0 |
| Inspecting hollow | 0 | 0 | 0 | 0 | 0 | 0 | 0 | 0 | 0 | 0 | 0 | 0 |
| Nest building | 0 | 0 | 0 | 12 | 23 | 7 | 2 | 0 | 0 | 0 | 0 | 0 |
| Nest with eggs | 0 | 0 | 0 | 1 | 6 | 2 | 1 | 0 | 0 | 0 | 0 | 0 |
| Nest with young | 0 | 0 | 0 | 0 | 6 | 18 | 15 | 1 | 0 | 0 | 0 | 0 |
| On/leaving nest | 0 | 0 | 0 | 4 | 25 | 24 | 2 | 2 | 0 | 0 | 0 | 0 |
Breeding records by year
Average number of breeding records per period by breeding code| Period | Breeding (BLA code) | Carrying Food | Copulating | Display | Dependent young | Faecal sac | Inspecting hollow | Nest building | Nest with eggs | Nest with young | On/leaving nest |
|---|---|---|---|---|---|---|---|---|---|---|---|
| All years | |||||||||||
| All | 0.3 | 0.5 | 0.1 | 0.4 | 2.5 | 0.0 | 0.0 | 1.2 | 0.3 | 1.1 | 1.6 |
| Previous years | |||||||||||
| All previous years | 0.3 | 0.5 | 0.1 | 0.4 | 2.3 | 0.0 | 0.0 | 1.2 | 0.3 | 1.1 | 1.5 |
| Previous 30 years | 0.4 | 0.6 | 0.1 | 0.5 | 2.7 | 0.0 | 0.0 | 1.4 | 0.3 | 1.3 | 1.8 |
| Previous 20 years | 0.6 | 0.6 | 0.0 | 0.7 | 2.8 | 0.0 | 0.0 | 1.2 | 0.2 | 1.1 | 2.5 |
| 10 year groups | |||||||||||
| [2007,2017) | 1.0 | 1.1 | 0.1 | 1.3 | 4.3 | 0.0 | 0.0 | 1.6 | 0.3 | 1.3 | 3.3 |
| [1997,2007) | 0.2 | 0.1 | 0.0 | 0.1 | 1.3 | 0.0 | 0.0 | 0.9 | 0.2 | 0.8 | 1.8 |
| [1987,1997) | 0.0 | 0.6 | 0.1 | 0.0 | 2.6 | 0.0 | 0.0 | 1.6 | 0.5 | 1.8 | 0.2 |
| 5 year groups | |||||||||||
| [2012,2017) | 1.4 | 1.2 | 0.0 | 1.8 | 5.2 | 0.0 | 0.0 | 1.6 | 0.4 | 1.0 | 4.4 |
| [2007,2012) | 0.6 | 1.0 | 0.2 | 0.8 | 3.4 | 0.0 | 0.0 | 1.6 | 0.2 | 1.6 | 2.2 |
| [2002,2007) | 0.2 | 0.2 | 0.0 | 0.2 | 1.8 | 0.0 | 0.0 | 1.2 | 0.0 | 1.4 | 2.0 |
| [1997,2002) | 0.2 | 0.0 | 0.0 | 0.0 | 0.8 | 0.0 | 0.0 | 0.6 | 0.4 | 0.2 | 1.6 |
| [1992,1997) | 0.0 | 0.0 | 0.2 | 0.0 | 0.6 | 0.0 | 0.0 | 0.6 | 0.0 | 0.0 | 0.4 |
| [1987,1992) | 0.0 | 1.2 | 0.0 | 0.0 | 4.6 | 0.0 | 0.0 | 2.6 | 1.0 | 3.6 | 0.0 |
| Year | |||||||||||
| 2017 | 0.0 | 0.0 | 0.0 | 0.0 | 8.0 | 0.0 | 0.0 | 1.0 | 0.0 | 1.0 | 4.0 |
| 2016 | 0.0 | 3.0 | 0.0 | 3.0 | 7.0 | 0.0 | 0.0 | 0.0 | 1.0 | 2.0 | 9.0 |
| 2015 | 0.0 | 2.0 | 0.0 | 3.0 | 6.0 | 0.0 | 0.0 | 1.0 | 0.0 | 0.0 | 6.0 |
| 2014 | 0.0 | 0.0 | 0.0 | 2.0 | 8.0 | 0.0 | 0.0 | 3.0 | 0.0 | 1.0 | 3.0 |
| 2013 | 3.0 | 1.0 | 0.0 | 1.0 | 5.0 | 0.0 | 0.0 | 1.0 | 0.0 | 2.0 | 2.0 |
| 2012 | 4.0 | 0.0 | 0.0 | 0.0 | 0.0 | 0.0 | 0.0 | 3.0 | 1.0 | 0.0 | 2.0 |
| 2011 | 1.0 | 0.0 | 0.0 | 0.0 | 3.0 | 0.0 | 0.0 | 0.0 | 0.0 | 0.0 | 1.0 |
| 2010 | 0.0 | 3.0 | 0.0 | 0.0 | 6.0 | 0.0 | 0.0 | 2.0 | 1.0 | 2.0 | 5.0 |
| 2009 | 1.0 | 2.0 | 0.0 | 0.0 | 1.0 | 0.0 | 0.0 | 1.0 | 0.0 | 2.0 | 1.0 |
| 2008 | 1.0 | 0.0 | 1.0 | 1.0 | 6.0 | 0.0 | 0.0 | 5.0 | 0.0 | 1.0 | 2.0 |
| 2007 | 0.0 | 0.0 | 0.0 | 3.0 | 1.0 | 0.0 | 0.0 | 0.0 | 0.0 | 3.0 | 2.0 |
| 2006 | 0.0 | 0.0 | 0.0 | 1.0 | 3.0 | 0.0 | 0.0 | 3.0 | 0.0 | 2.0 | 3.0 |
| 2005 | 0.0 | 0.0 | 0.0 | 0.0 | 2.0 | 0.0 | 0.0 | 1.0 | 0.0 | 3.0 | 5.0 |
| 2004 | 0.0 | 1.0 | 0.0 | 0.0 | 3.0 | 0.0 | 0.0 | 1.0 | 0.0 | 0.0 | 2.0 |
| 2003 | 1.0 | 0.0 | 0.0 | 0.0 | 0.0 | 0.0 | 0.0 | 0.0 | 0.0 | 0.0 | 0.0 |
| 2002 | 0.0 | 0.0 | 0.0 | 0.0 | 1.0 | 0.0 | 0.0 | 1.0 | 0.0 | 2.0 | 0.0 |
| 2001 | 1.0 | 0.0 | 0.0 | 0.0 | 0.0 | 0.0 | 0.0 | 1.0 | 0.0 | 1.0 | 1.0 |
| 2000 | 0.0 | 0.0 | 0.0 | 0.0 | 2.0 | 0.0 | 0.0 | 1.0 | 0.0 | 0.0 | 1.0 |
| 1999 | 0.0 | 0.0 | 0.0 | 0.0 | 1.0 | 0.0 | 0.0 | 1.0 | 0.0 | 0.0 | 2.0 |
| 1998 | 0.0 | 0.0 | 0.0 | 0.0 | 1.0 | 0.0 | 0.0 | 0.0 | 2.0 | 0.0 | 2.0 |
| 1997 | 0.0 | 0.0 | 0.0 | 0.0 | 0.0 | 0.0 | 0.0 | 0.0 | 0.0 | 0.0 | 2.0 |
| 1996 | 0.0 | 0.0 | 1.0 | 0.0 | 0.0 | 0.0 | 0.0 | 0.0 | 0.0 | 0.0 | 0.0 |
| 1995 | 0.0 | 0.0 | 0.0 | 0.0 | 2.0 | 0.0 | 0.0 | 0.0 | 0.0 | 0.0 | 0.0 |
| 1994 | 0.0 | 0.0 | 0.0 | 0.0 | 0.0 | 0.0 | 0.0 | 0.0 | 0.0 | 0.0 | 0.0 |
| 1993 | 0.0 | 0.0 | 0.0 | 0.0 | 0.0 | 0.0 | 0.0 | 0.0 | 0.0 | 0.0 | 1.0 |
| 1992 | 0.0 | 0.0 | 0.0 | 0.0 | 1.0 | 0.0 | 0.0 | 3.0 | 0.0 | 0.0 | 1.0 |
| 1991 | 0.0 | 1.0 | 0.0 | 0.0 | 1.0 | 0.0 | 0.0 | 0.0 | 0.0 | 1.0 | 0.0 |
| 1990 | 0.0 | 0.0 | 0.0 | 0.0 | 1.0 | 0.0 | 0.0 | 1.0 | 0.0 | 1.0 | 0.0 |
| 1989 | 0.0 | 3.0 | 0.0 | 0.0 | 7.0 | 0.0 | 0.0 | 7.0 | 1.0 | 4.0 | 0.0 |
| 1988 | 0.0 | 1.0 | 0.0 | 0.0 | 9.0 | 0.0 | 0.0 | 4.0 | 4.0 | 7.0 | 0.0 |
| 1987 | 0.0 | 1.0 | 0.0 | 0.0 | 5.0 | 0.0 | 0.0 | 1.0 | 0.0 | 5.0 | 0.0 |
| 1986 | 0.0 | 0.0 | 0.0 | 0.0 | 0.0 | 0.0 | 0.0 | 2.0 | 0.0 | 0.0 | 0.0 |
| 1985 | 0.0 | 0.0 | 0.0 | 0.0 | 0.0 | 0.0 | 0.0 | 0.0 | 0.0 | 0.0 | 0.0 |
| 1984 | 0.0 | 0.0 | 0.0 | 0.0 | 0.0 | 0.0 | 0.0 | 0.0 | 0.0 | 0.0 | 0.0 |
| 1983 | 0.0 | 0.0 | 0.0 | 0.0 | 0.0 | 0.0 | 0.0 | 0.0 | 0.0 | 0.0 | 0.0 |
| 1982 | 0.0 | 0.0 | 0.0 | 0.0 | 0.0 | 0.0 | 0.0 | 0.0 | 0.0 | 0.0 | 0.0 |
Distribution map
Distribution - 2017
This map shows the observed distribution of the White-winged Triller for 2017.
The red circles are the grid cells where White-winged Triller have been reported.
The transparency of the red circles indicate how many surveys sheets were submitted for that grid cell; the darker the red the more reliable the data. Of the 315 grid cells with reports, 83 had only one sheet; an example is grid number A11.
The size of the circle represents the reporting rate. The maximum reporting rate for White-winged Triller was 50.0% (eg grid number Z12) and the minimum was 0.1% (eg grid number K13). 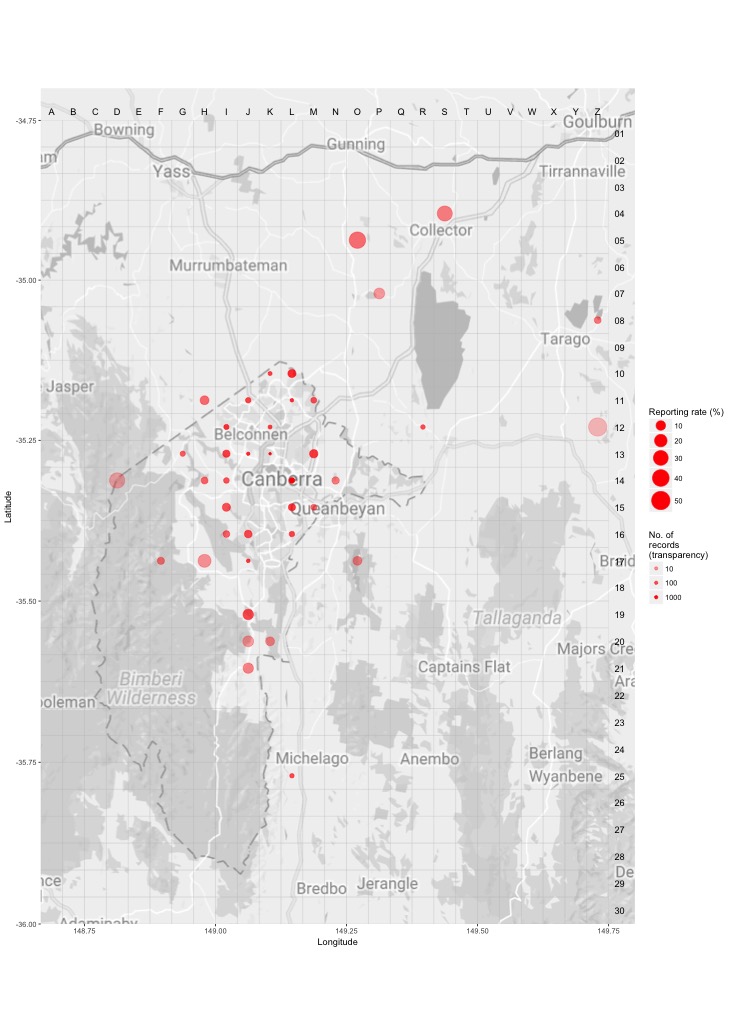
Distribution - all years
This map shows the observed distribution of the White-winged Triller for all years.
The red circles are the grid cells where White-winged Triller have been reported.
The transparency of the red circles indicate how many surveys sheets were submitted for that grid cell; the darker the red the more reliable the data. Of the 703 grid cells with reports, 55 had only one sheet; an example is grid number A12.
The size of the circle represents the reporting rate. The maximum reporting rate for White-winged Triller was 50.0% (eg grid number M4) and the minimum was 0.1% (eg grid number S13). 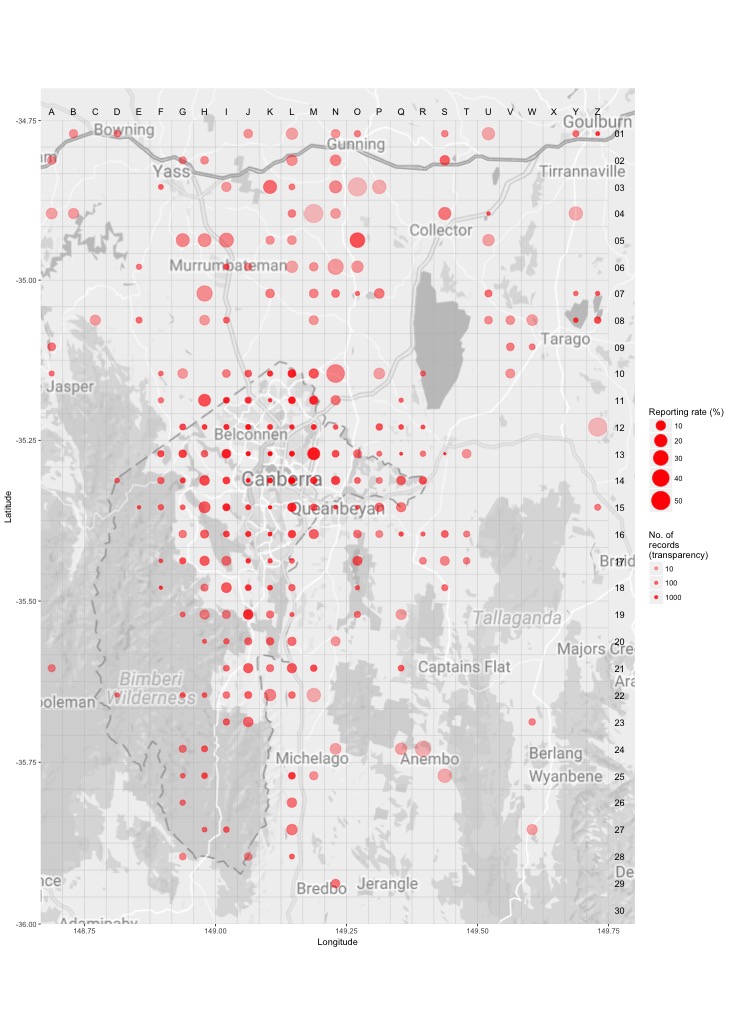
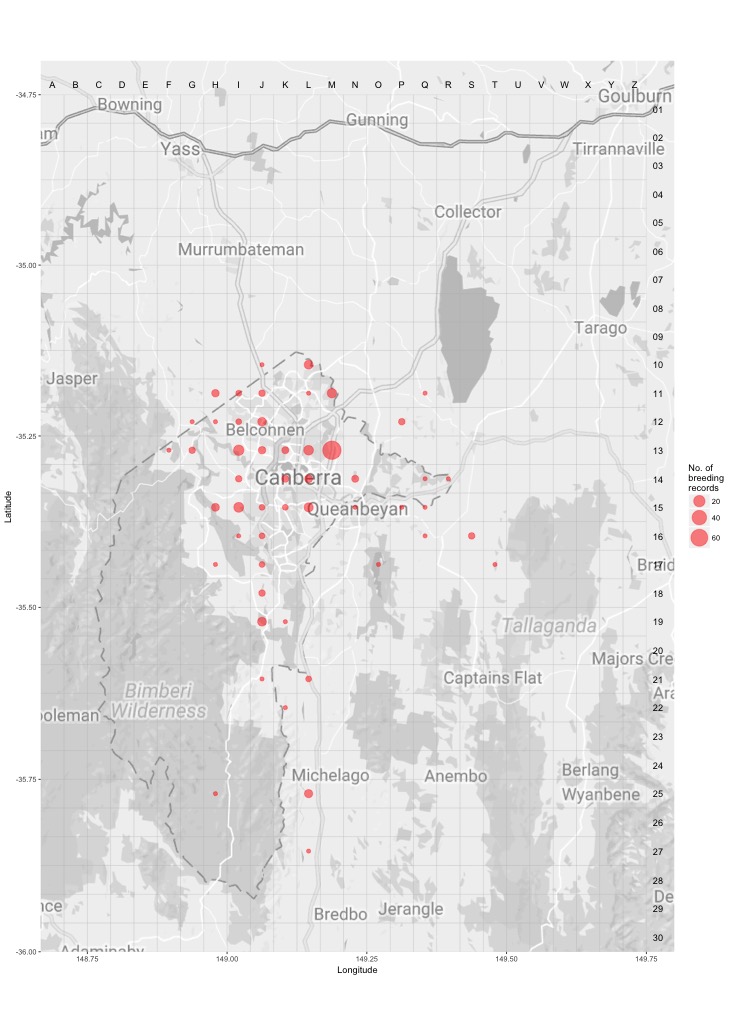
Breeding map
Breeding - 2017
This map shows the breeding distribution of the White-winged Triller for 2017.
The red circles are the grid cells where breeding activity for White-winged Triller have been reported.
The size of the circle represents the number of reports. 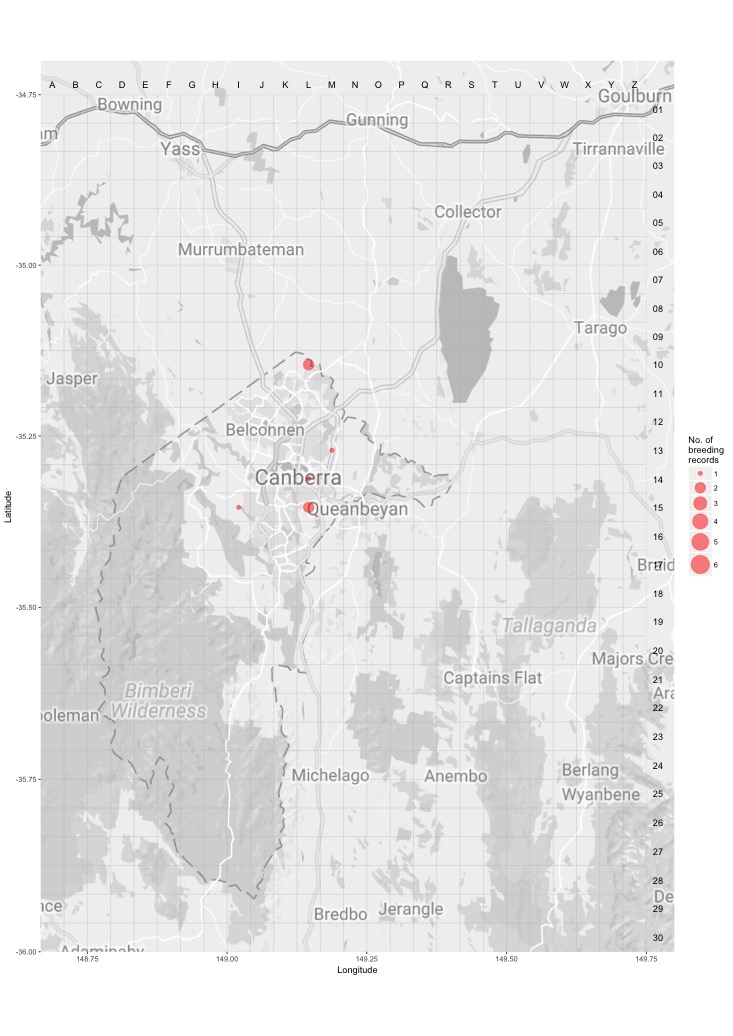
Breeding - all years
This map shows the breeding distribution of the White-winged Triller for all years.
The red circles are the grid cells where breeding activity for White-winged Triller have been reported.
The size of the circle represents the number of reports.